
In our current era, data is the "new oil"!
Every interaction with a customer, every sale, and every click on your website is a valuable piece of information.
However, simply collecting this data is not enough; its true value lies in your ability to analyze and understand it and extract actionable insights from it.
Companies often find themselves drowning in a sea of raw data they cannot comprehend, causing them to miss golden opportunities for growth.
This is where Zoho Analytics stands out as a powerful tool that transforms this data into your secret weapon for achieving market superiority.
Today, learn with us how to use Zoho Analytics to unleash the potential of your data.
We will delve into understanding the essence of the system, which is graphical analysis, and how interactive dashboards, along with many other features it offers, enable you to monitor your business in real-time. Get ready to turn your data from mere numbers into a decisive competitive advantage!
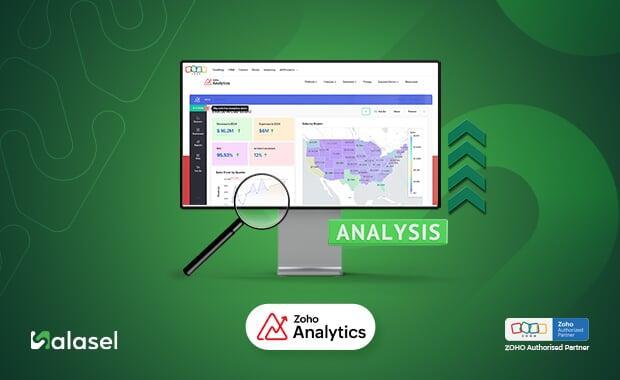
What is Zoho Analytics and Why is it Essential for Your Business?
Zoho Analytics is a cloud-based business intelligence (BI) and graphical analysis platform designed to help businesses of all sizes collect, analyze, and visualize their data.
It serves as a bridge that connects your raw data with the valuable insights you need to make better decisions.
What makes it essential for your business's success?
Extreme Ease of Use: You don't need to be a data scientist or an expert analyst to use it.
The intuitive user interface enables anyone to create professional reports and dashboards.Comprehensive Integration: It can connect to more than 500 different data sources, including Zoho applications (such as CRM and Books), as it is integrated with the Zoho One suite, as well as external applications (like Salesforce and Google Ads), traditional databases, and even Excel files.
An Economical and Flexible Solution: It offers advanced features at competitive prices, making it the ideal choice for small and medium-sized businesses that want to get enterprise-level business intelligence.
Therefore, it is a strong investment with guaranteed returns!
Let's remember the "oil" example we mentioned at the beginning of the article.
As you know, raw oil is worth much less than refined oil, which is processed to extract many other materials from it, each of which is valued higher.
Zoho Analytics will help you not only in extracting this raw data, but it is also an integrated station for processing and refining this data and presenting it to you so that you can benefit from its highest value!
The Power of Visuals: How to Master Graphical Analysis?
Graphical analysis is the core of Zoho Analytics.
While raw numbers can be boring and unclear, converting them into charts and graphs gives them life and highlights patterns and trends that might be hidden.
Here's how Zoho Analytics' graphical analysis tools enable you to understand your data more deeply:
Identify Trends and Patterns: You can use line charts to see sales trends throughout the year, which helps you identify the busiest seasons or periods of stagnation.
Compare Performance: Bar charts and pie charts enable you to compare the performance of different products, geographical sales regions, or even the performance of the sales team.
Discover Relationships: You can use Scatter Plots to understand the relationship between two different variables, such as the relationship between marketing spending and the number of visitors to your website.
Understand Geographical Concentration: Interactive maps enable you to know the regions your customers come from, which helps you direct your marketing efforts more effectively.
Graphical analysis turns data from a burden into an opportunity and makes it easy for anyone in your company to understand the situation and make informed decisions.
Actionable Insights: The Magic of Interactive Dashboards
If graphical analysis is the power of vision, then dashboards are the power of execution. A dashboard in Zoho Analytics is a comprehensive "command center" for your business, where all important metrics and graphs are displayed in one place.
Why are dashboards essential for turning data into a competitive advantage?
Quick Access to Key Metrics: Instead of searching through different reports, dashboards give you an instant overview of your business's performance. In a single glance, you can know your total revenue, conversion rates, inventory levels, and more.
Real-time Data: Dashboards are automatically updated with your new data, which ensures you are always working based on the latest available information.
Customization by Job Role: You can create customized dashboards for different departments.
For example, a sales dashboard might contain metrics such as sales revenue and sales rep performance, while a marketing dashboard might focus on campaign performance and the number of visitors.Drill-down Capability: Interactive dashboards enable you to click on any chart or number to delve into the underlying data, which helps you understand the reasons behind the numbers.
Thanks to dashboards, data doesn't just become forgotten reports; it becomes a powerful, living tool that helps you make quick and proactive decisions.
Your Practical Guide: From Data to Effectiveness and Competitiveness with Zoho Analytics
We have learned about the importance of data and how our powerful tool helps you obtain, classify, and benefit from data.
Are there more advantages and benefits? Absolutely, and the most important ones are:
Connect Data Sources: Start by connecting Zoho Analytics to all of your data sources, whether they are from Zoho applications, social media platforms, or even Excel files.
Clean and Prepare Data: Use the data preparation tools in Zoho Analytics to ensure the accuracy and consistency of your information before you start analyzing it.
Create Reports and Graphs: Start by creating simple reports to understand the main trends in your business.
You can use the "Ask Zia" feature, the AI assistant, to ask questions in natural language and get answers in the form of graphs.Build Dashboards: Compile the most important graphs into customized dashboards to monitor performance in real-time.
Share these dashboards with your team to encourage a culture of making decisions based on data.Collaborate and Share: Share your reports and dashboards with your team members and colleagues, giving them access to the insights you have discovered.
All of this helps you better understand your data and get the maximum benefit from it.
My friend, Zoho Analytics is the tool you need to unleash the power of your data.
Through powerful graphical analysis tools and the flexibility of interactive dashboards, you can turn raw data into actionable insights that enable you to identify opportunities, predict future trends, and continuously improve your business performance.
In a competitive market, success will not go to those who have the most data, but to those who have the ability to understand it and use it intelligently.
Are you ready to embark on your journey towards making better decisions and achieving an unparalleled competitive advantage?